

Explainable AI for Time Series Forecasts: Making Forecasts Explainable with SHAP
10.03.2026

Senior Data Scientist
Why Does Forecasting Need Explainable AI?
Time-series forecasts serve as an operational management tool within organizations. Forecasts are regularly updated, discussed, and translated into decisions. This is precisely why a recurring acceptance issue arises: forecasts are perceived as a “black box.”
Business users expect plausibility and trust. They need to be able to understand a forecast and explain it to others. Two questions are central here: Which drivers influence the forecast, and where does a change come from when a new forecast is made using updated data (e.g., a forecast for March is made in January and then again in February)?
Explainable AI (XAI) addresses these requirements by making forecast values transparent—showing how they are derived and why they change between two forecast runs.
Management Summary: What are the business benefits of explainable time-series forecasts?
Explainable time-series forecasts are relevant to decision-makers because forecasting systems influence decisions through their forecasts. If forecasts are perceived as a “black box,” acceptance declines—regardless of how good the models are.
A robust XAI approach creates transparency in two dimensions:
- Explaining forecast drivers: Which factors drive a specific forecast?
- Explaining forecast revisions: Why has the forecast changed in the next forecasting period?
Forecast revisions are unavoidable in practice. They typically result from new target values, updated features, or model changes (parameters, indicators, algorithm).
A central methodological foundation for this is SHAP values, which explain predictions as additive contributions.
What models are used in time-series forecasting?
In practice, time series forecasts are implemented using various model classes. These are typically categorized as statistical, machine learning (ML), and deep learning (DL) methods, as well as linear (e.g., VAR) and nonlinear models (e.g., XGBoost).
In production environments, forecasts are often generated automatically, e.g., via Auto-ML (statistical, ML, and DL methods) and using a feature pool.
What are SHAP scores, and how do they explain time-series forecasts?
SHAP (SHapley Additive exPlanations) is based on Shapley values from coalition-theoretic game theory. Feature values of a data instance are treated as “players.” The prediction is interpreted as a “payoff” that is distributed fairly among the features.
The key property for forecasting is additivity:
The sum of the SHAP values for a forecast corresponds to the difference between the specific forecast and the mean forecast.
This allows a forecast to be represented as a baseline plus individual contributions. This forms the basis for transparent explanations of drivers.
How can you explain forecast drivers in time-series models in a way that's easy to understand?
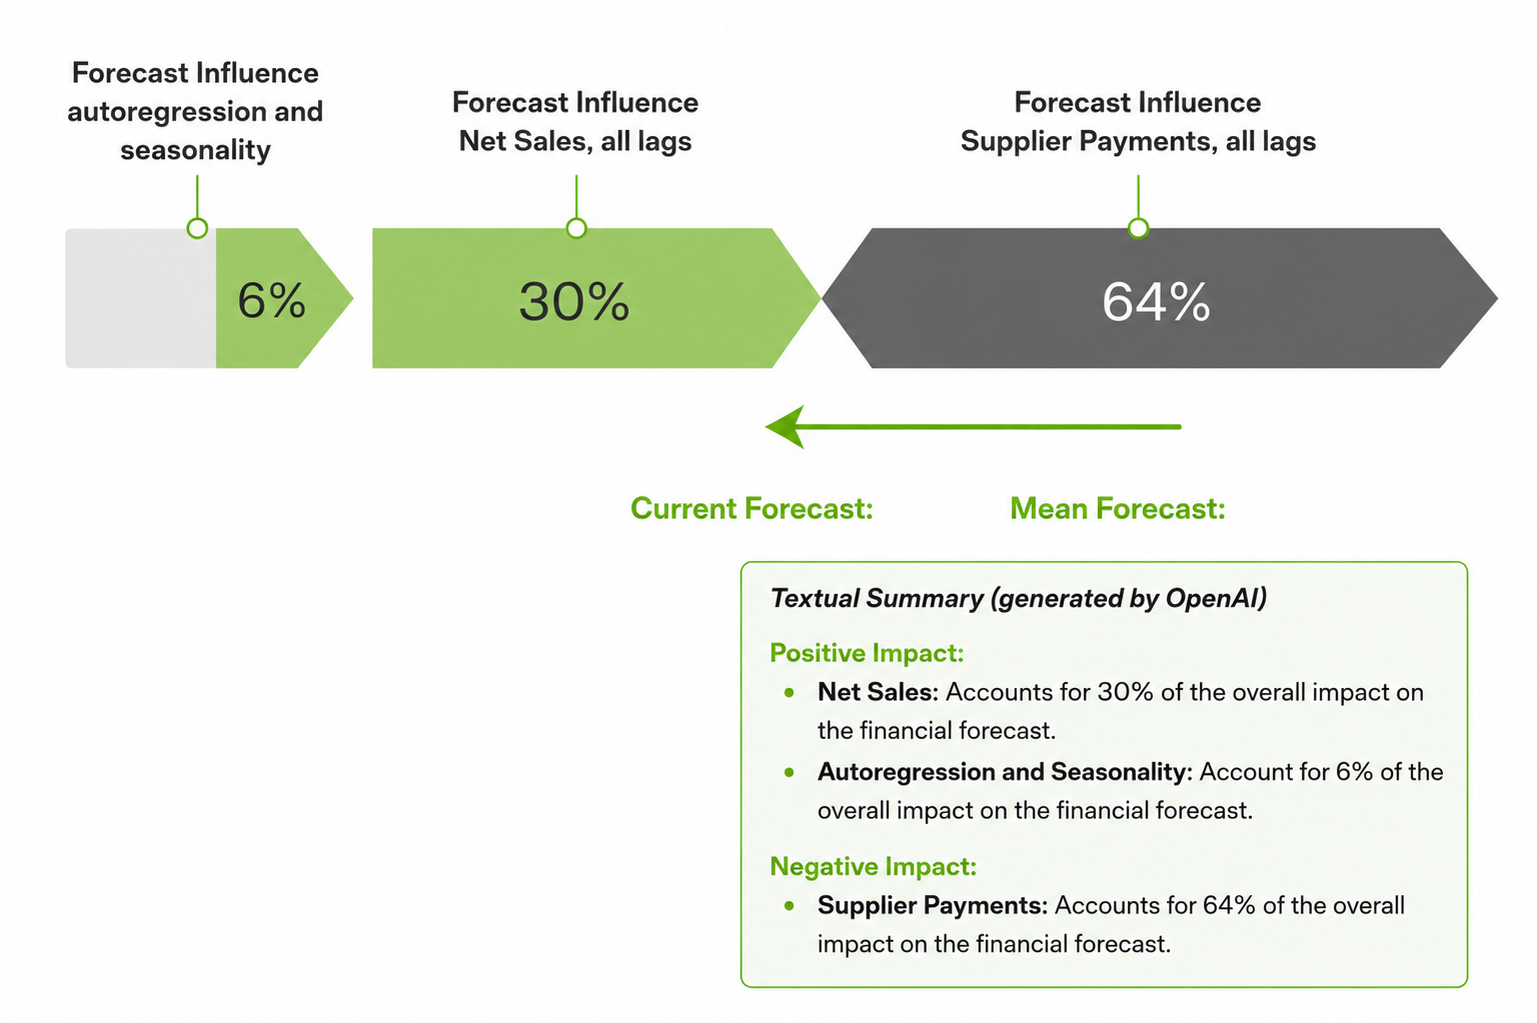
Time-series forecasts can generate a great many factors, particularly due to lag structures and multiple external indicators. It is therefore crucial for the target audience that explanations be simplified.
One practical approach is aggregation: autoregression and seasonality are presented as a separate set of factors, while indicators are summarized across all lags.
In addition, a textual summary can be generated that describes the most important positive and negative influences.
In practice, the following is key: For some business users, textual explanations are important, and reducing complexity is essential.
How can you explain forecast revisions?
Forecast revisions are the most common point at which trust is gained or lost: Why does a forecast differ between two points in time, even though it refers to the same month?
Two typical questions are:
- Difference between forecasts for the same month made at different times
- The difference between forecasts for consecutive months
The core methodology is clear:
Forecast differences are explained by subtracting the SHAP values of the forecasts.
This reveals which influencing factors and which changes are driving the revision.
Why do forecasts change between two forecast runs?
Forecasts may differ between two runs for clearly identifiable reasons:
- new values in the target time series (e.g., a new January value)
- new values for an indicator (if no projection is used)
- Updates to indicator values, particularly in the case of projections
- Model changes resulting from these changes: different parameters, different indicators, possibly a different “better” algorithm
This causal logic is crucial because it provides structure to discussions: A revision is not “inexplicable,” but can be traced back to specific changes.
What must Explainable AI be able to do in production forecasting systems?
Explainability is effective only if it remains applicable in practice.
Practical considerations include:
- Comparisons between different models and model types are possible, but are often difficult or of little practical value.
- Models should be modified as little as possible between two predictions to improve comparability.
- Textual explanations can be important for business users; reducing complexity is essential.
What challenges arise when implementing XAI in forecasting?
Explainable AI in time-series forecasting can be clearly described in methodological terms. In practice, however, structural hurdles arise.
1. No standard solution for time-series XAI
Standard libraries exist for SHAP values. However, in their basic form, these are not specifically designed for time-series models.
Time-series models contain:
Lag structures
Autoregression
Seasonality
grouped indicators
Direct application of standard SHAP implementations therefore often results in explanations that are mathematically correct but not meaningfully aggregated for time-series structures.
Explainable time-series forecasts therefore require an adjustment to the presentation and aggregation—especially for lag-based effects.
2. Retrospective integration is resource-intensive
In practice, it has been shown that
when Explainable AI is integrated into existing forecasting systems only after the fact, the implementation effort is considerable.
SHAP calculations must be:
be integrated into existing model pipelines
be versioned
be made comparable across multiple forecast runs
be converted into visualizations or text summaries
Experience shows that incorporating explainability into the system architecture early on is significantly easier than integrating it later.
3. Close collaboration with users is necessary
Explainability is not purely a technical problem.
Even if SHAP scores are calculated correctly, this does not automatically mean that the explanations will be accepted or understood.
In practice, close collaboration with business users is necessary to:
define appropriate levels of aggregation
adapt terminology
prioritize relevant drivers
develop understandable presentation formats
Explanations will only be used if they meet the target audience’s actual information needs.
Conclusion: The Central Thesis on Explainable AI for Time Series Forecasts
Forecast systems are not judged solely on whether they deliver forecast values. They are judged on whether those values are understood and utilized.
SHAP provides a methodological framework for explaining forecast drivers as additive contributions. However, the key added value arises during revisions:
Forecast revisions become explainable by differentiating the SHAP scores of two forecasts.
The central thesis is:
A forecasting system does not become trustworthy through more complex models, but through explainable revisions.
FAQ: Explainable AI in Forecasting